Explain the various data mining task primitives in detail.
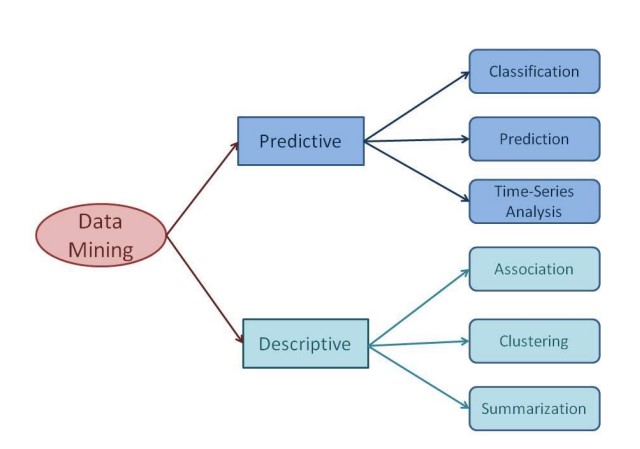
The data mining tasks can be classified generally into two types based on what a specific task tries to achieve. Those two categories are descriptive tasks and predictive tasks. The descriptive data mining tasks characterize the general properties of data whereas predictive data mining tasks perform inference on the available data set to predict how a new data set will behave.
Different Data Mining Tasks
There are a number of data mining tasks such as classification, prediction, time-series analysis, association, clustering, summarization, etc. All these tasks are either predictive data mining tasks or descriptive data mining tasks. A data mining system can execute one or more of the above-specified tasks as part of data mining.
Predictive data mining tasks come up with a model from the available data set that is helpful in predicting unknown or future values of another data set of interest. A medical practitioner trying to diagnose a disease based on the medical test results of a patient can be considered as a predictive data mining task.
Descriptive data mining tasks usually find data describing patterns and come up with new, significant information from the available data set. A retailer trying to identify products that are purchased together can be considered as a descriptive data mining task.
a) Classification
Classification derives a model to determine the class of an object based on its attributes. A collection of records will be available, each record with a set of attributes. One of the attributes will be a class attribute and the goal of the classification task is assigning a class attribute to the new set of records as accurately as possible.
Classification can be used in direct marketing, that is to reduce marketing costs by targeting a set of customers who are likely to buy a new product. Using the available data, it is possible to know which customers purchased similar products and who did not purchase in the past. Hence, {purchase, don’t purchase} decision forms the class attribute in this case. Once the class attribute is assigned, demographic and lifestyle information of customers who purchased similar products can be collected and promotion emails can be sent to them directly.
b) Prediction
The prediction task predicts the possible values of missing or future data. Prediction involves developing a model based on the available data and this model is used in predicting future values of a new data set of interest. For example, a model can predict the income of an employee based on education, experience, and other demographic factors like place of stay, gender etc. Also prediction analysis is used in different areas including medical diagnosis, fraud detection etc.
c) Time - Series Analysis
Time series is a sequence of events where the next event is determined by one or more of the preceding events. Time series reflects the process being measured and there are certain components that affect the behavior of a process. Time series analysis includes methods to analyze time-series data in order to extract useful patterns, trends, rules, and statistics. Stock market prediction is an important application of time-series analysis.
d) Association
Association discovers the association or connection among a set of items. Association identifies the relationships between objects. Association analysis is used for commodity management, advertising, catalog design, direct marketing, etc. A retailer can identify the products that normally customers purchase together or even find the customers who respond to the promotion of the same kind of products. If a retailer finds that beer and nappy are bought together mostly, he can put nappies on sale to promote the sale of beer.
e) Clustering
Clustering is used to identify data objects that are similar to one another. The similarity can be decided based on a number of factors like purchase behavior, responsiveness to certain actions, geographical locations, and so on. For example, an insurance company can cluster its customers based on age, residence, income, etc. This group information will be helpful to understand the customers better and hence provide better-customized services.
f) Summarization
Summarization is the generalization of data. A set of relevant data is summarized which results in a smaller set that gives aggregated information of the data. For example, the shopping done by a customer can be summarized into total products, total spending, offers used, etc. Such high-level summarized information can be useful for sales or customer relationship teams for detailed customer and purchase behavior analysis. Data can be summarized at different abstraction levels and from different angles.
Summary
Different data mining tasks are the core of the data mining process. Different prediction and classification data mining tasks actually extract the required information from the available data sets.


Comments
Post a Comment