Short note on Mining Data Streams.

 Mining Data Streams

Stream data refer to data that flows into a system in vast volumes, change dynamically, are possibly infinite, and contain multidimensional features. Such data cannot be stored in traditional database systems. Moreover, most systems may only be able to read the stream once in sequential order. This poses great challenges for the effective mining of stream data. Substantial research has led to progress in the development of efficient methods for mining data streams, in the areas of mining frequent and sequential om patterns, multidimensional analysis (e.g., the construction of stream cubes), classification, clustering, outlier analysis, and online detection of rare events in data streams. The general philosophy is to develop single-scan or a-few-scan algorithms using limited computing and storage capabilities. 

 This includes collecting information about stream data in sliding windows or tilted time windows (where the most recent data are registered at the finest granularity and the more distant data are registered at a coarser granularity), and exploring techniques like micro clustering, limited aggregation, and approximation. Many applications of stream data mining can be an explored-for example, real-time detection of anomalies in computer network traffic, botnets, text streams, video streams, power-grid flows, web searches, sensor networks, and cyber-physical systems.

Comments

Popular posts from this blog

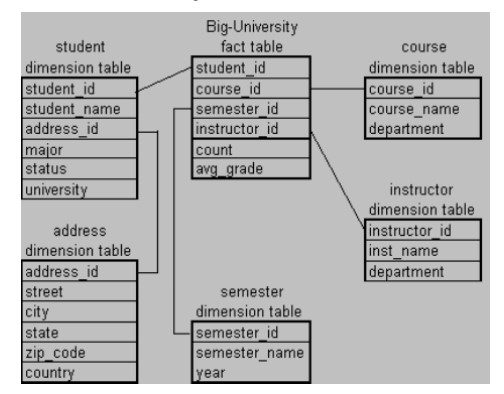
Suppose that a data warehouse for Big-University consists of the following four dimensions: student, course, semester, and instructor, and two measures count and avg_grade. When at the lowest conceptual level (e.g., for a given student, course, semester, and instructor combination), the avg_grade measure stores the actual course grade of the student. At higher conceptual levels, avg_grade stores the average grade for the given combination. a) Draw a snowflake schema diagram for the data warehouse. b) Starting with the base cuboid [student, course, semester, instructor], what specific OLAP operations (e.g., roll-up from semester to year) should one perform in order to list the average grade of CS courses for each BigUniversity student. c) If each dimension has five levels (including all), such as “student < major < status < university < all”, how many cuboids will this cube contain (including the base and apex cuboids)?

Suppose that a data warehouse consists of the four dimensions; date, spectator, location, and game, and the two measures, count and charge, where charge is the fee that a spectator pays when watching a game on a given date. Spectators may be students, adults, or seniors, with each category having its own charge rate. a) Draw a star schema diagram for the data b) Starting with the base cuboid [date; spectator; location; game], what specific OLAP operations should perform in order to list the total charge paid by student spectators at GM Place in 2004?

Discuss classification or taxonomy of virtualization at different levels.