Difference between work break down structure and product break down structure with an example.

 Work break down structure 

Work breakdown structure is a visual, hierarchical, and deliverables-oriented deconstruction of a project. A WBS includes dividing a large and complex project into a simpler manageable and independent task. The root of this tree (structure) is labeled by the project name itself. For constructing a WBS, each node is recursively decomposed into smaller sub-activities until at the leaf level the activities become undividable and independent, It follows a top-down approach. WBS is the method for time scheduling cost estimation and error handling.

Example:-


Product breakdown structure

The product breakdown structure is a hierarchical structure of things that the project will make or outcomes that it will deliver, It begins with the final product at the top of the hierarchy followed by the sub-categories element of the product. the product breakdown structure is similar to the work breakdown structure. The PB is supported by a product log and associated product description that describes individual products in more detail.

Example:


Comments

Popular posts from this blog

Suppose that a data warehouse for Big-University consists of the following four dimensions: student, course, semester, and instructor, and two measures count and avg_grade. When at the lowest conceptual level (e.g., for a given student, course, semester, and instructor combination), the avg_grade measure stores the actual course grade of the student. At higher conceptual levels, avg_grade stores the average grade for the given combination. a) Draw a snowflake schema diagram for the data warehouse. b) Starting with the base cuboid [student, course, semester, instructor], what specific OLAP operations (e.g., roll-up from semester to year) should one perform in order to list the average grade of CS courses for each BigUniversity student. c) If each dimension has five levels (including all), such as “student < major < status < university < all”, how many cuboids will this cube contain (including the base and apex cuboids)?

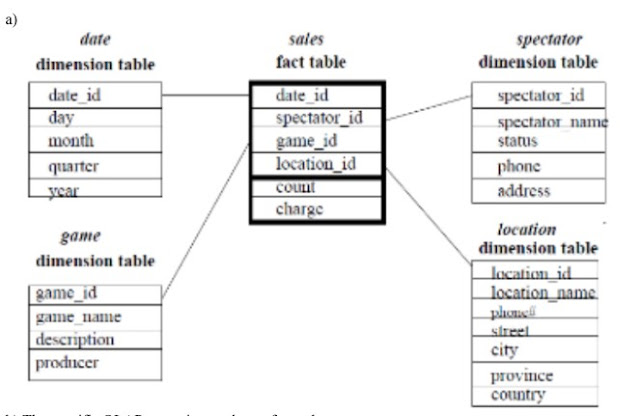
Suppose that a data warehouse consists of the four dimensions; date, spectator, location, and game, and the two measures, count and charge, where charge is the fee that a spectator pays when watching a game on a given date. Spectators may be students, adults, or seniors, with each category having its own charge rate. a) Draw a star schema diagram for the data b) Starting with the base cuboid [date; spectator; location; game], what specific OLAP operations should perform in order to list the total charge paid by student spectators at GM Place in 2004?

Discuss classification or taxonomy of virtualization at different levels.